
Startups do not need dozens of finance reports. They need a small, repeatable management reporting pack that turns actual results into decisions, and that is exactly why firms like CBMC, an accounting, tax, advisory, and technology-enabled professional services firm, treat management reporting as part of budgeting, cash flow, and KPIs and board-facing finance support.
TL;DR: Summary
- Startups should standardise management reporting around four core templates: a monthly actual-vs-budget report, a rolling cash flow forecast, a KPI dashboard, and a 3-statement model; CBMC groups the same reporting stack with budgeting, cash flow, and board-ready reporting in its CFO services scope.
- The best cadence is monthly for the full reporting pack and weekly for cash runway when payroll, collections, or fundraising timing is tight.
- Strong management reporting shows actual and budgeted amounts, material variances, updated forecasts, and a short commentary on actions, not just raw numbers.
- If a startup has multiple entities, inventory, payroll complexity, investor updates, or cross-border reporting needs, then spreadsheet-only reporting usually stops being reliable enough.
The pattern is consistent across official guidance and startup finance practice: reporting works best when it is periodic, updated from actual results, and tied to planning and control. For a startup, that means fewer templates, clearer ownership, and a month-end process that produces the same answers every time.
Why do startups need standard management reporting templates?
Yes, startups need a repeatable reporting pack, and CBMC places management reporting beside budgeting, cash flow, and KPIs because founders need planning and control, not disconnected spreadsheets.
Official guidance from Western Washington University describes management reports as workbook-based financial snapshots with forecast inputs, while university controller guidance frames forecast reporting as a management tool for planning and control. That matters for startups because the goal is not accounting for its own sake. The goal is to see what happened, what is changing, and what needs a decision this month.
A common misconception is that management reporting is only for boards or investors. In practice, it is even more important for founders and finance leads. If revenue is growing but collections are slipping, then the income statement can look healthy while cash runway shortens. If hiring is ahead of plan, then burn rate will shift before annual budgets are formally revised.
“CBMC defines management reporting in its CFO services scope as KPIs and board-ready reports.”
Standard templates also reduce argument about whose numbers are correct. When everyone uses the same revenue, payroll, gross margin, and cash definitions, performance monitoring becomes faster and more useful.
How often should startups update management reports?
Most startups should update the full management reporting pack monthly, then refresh cash reporting weekly, or even daily during tight cash periods.
Step 1 is the monthly close. Once the month closes, post actuals, reconcile bank and key balance sheet accounts, and lock the data set used for reporting. Without this step, every report becomes a moving target.
Step 2 is the management pack update. Load actuals into the actual-vs-budget report, refresh the KPI dashboard, and revise the rolling forecast using the latest run rate, pipeline, payroll, and creditor timings. This is where projected figures start getting replaced by real monthly results.
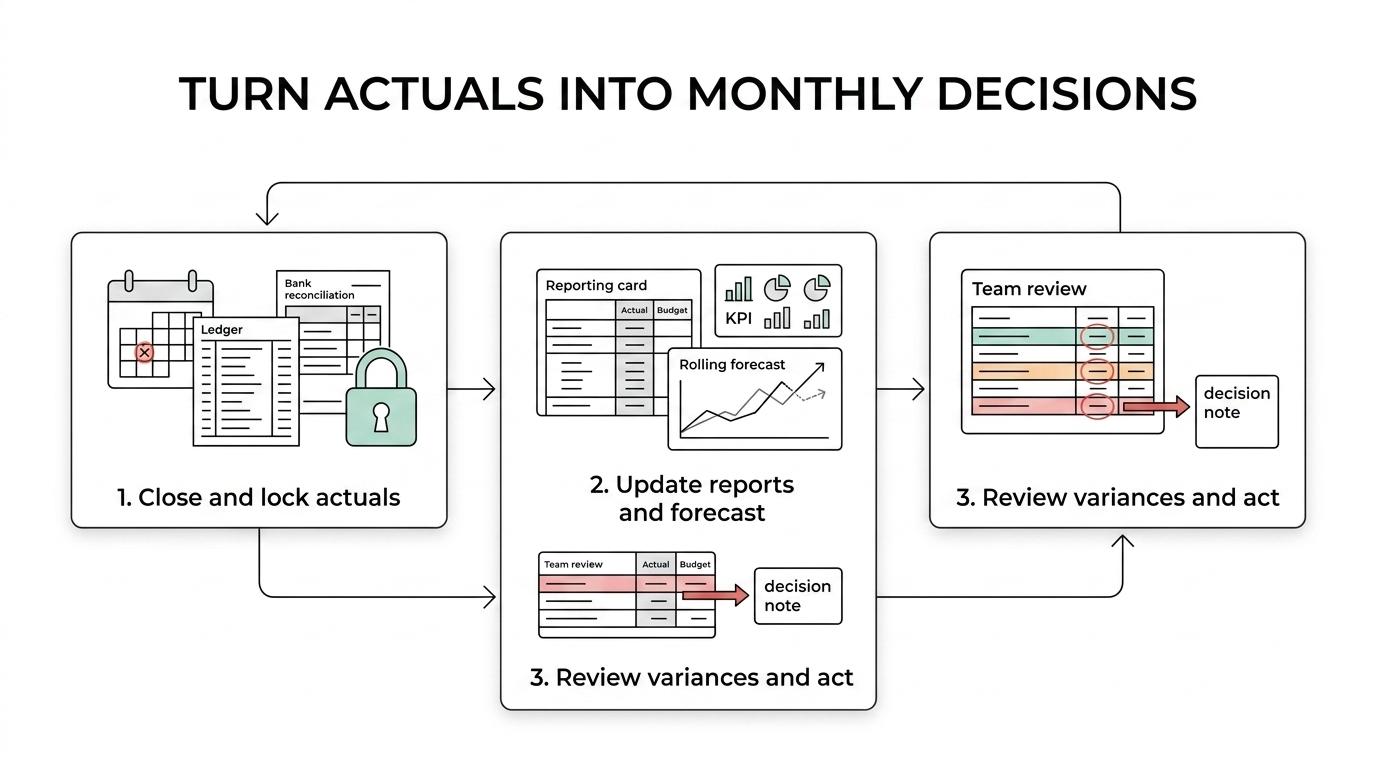
Step 3 is exception-based review. The meeting should focus on material variances, not every line item. If gross margin drops, then ask whether pricing, discounts, input costs, or product mix changed. If receivables days stretch, then the action may sit with collections, contracts, or billing discipline rather than sales.
A practical rule works well for early-stage companies: monthly for the full pack, weekly for cash, and ad hoc only for major events like fundraising, capex, or a delayed customer payment.
What are the core management reporting templates every startup should use?
Every startup should use a short reporting stack of seven templates. These cover performance, cash, forecast accuracy, and investor communication without creating reporting overload.
-
Monthly actual-vs-budget report: The core control document. It compares actual and budgeted amounts by month and year to date, then highlights variances that need action.
-
Rolling cash flow forecast: The survival report. It estimates receipts, payments, and net cash movement over the next 13 weeks or longer, then updates from actual collections and spending.
-
3-statement model: The planning engine. Penn State Smeal describes this integrated model as a common startup tool linking the income statement, balance sheet, and cash flow statement for scenario modelling and forecasting.
-
Burn rate and cash runway tracker: The funding reality check. It shows how fast cash is being consumed and how many months remain under current assumptions.
-
KPI dashboard: The operating scorecard. This may include MRR, churn, CAC, gross margin, utilisation, order fulfilment, or patient volumes depending on the business model.
-
Department, product, or project profitability report: The margin lens. It separates growth that creates value from growth that only adds activity.
-
Board-ready reporting pack: The decision summary. It compresses the month into a few pages with financials, KPIs, risks, actions, and forecast changes.
If a startup is pre-revenue, then the KPI mix may lean toward product, pipeline, hiring, and runway. If it is already scaling, then gross margin, working capital, and customer retention become harder to ignore.
How do you build a monthly actual-vs-budget report?
A good actual-vs-budget report starts with actuals, budget, variance, and forecast in one place, then explains only the movements that matter.
Western Washington University’s guidance is useful here because it treats forecast input as part of the report, not as a separate exercise. That is a smart startup habit. The report should not stop at “variance identified”. It should continue to “variance explained” and “reforecast updated”.
A clean startup version usually includes monthly figures, year-to-date figures, the full-year budget, the latest full-year forecast, and comments. One common mistake is reporting percentages without value impact. A 20% overspend sounds dramatic, but PKR 40,000 may matter far less than a 3% revenue miss on a large contract.
Use these fields consistently:
- Revenue lines: actual, budget, variance value, variance %
- Cost lines: direct costs, payroll, software, marketing, overheads
- Forecast view: latest full-year estimate and remaining-month assumptions
- Commentary: cause, owner, and next action
Pro tip: limit commentary to material items. If every line gets a note, then no one can see the real problem.
What is the difference between a cash flow forecast and a budget?
A budget sets intent for the year, while a cash flow forecast tracks the timing of money in and money out. They are connected, but they answer different questions.
Massachusetts government guidance says cash flow forecasting should be developed after the annual budget is approved, then progressively replaced with actual monthly receipts and expenditures as the year unfolds. That is the key distinction. The budget says what you expect to earn and spend. The cash forecast says when the bank account will feel it.
Here is the trade-off. Budgets are stable enough to manage targets, team plans, and spending limits. Cash flow forecasts must be more dynamic because payment timing changes constantly. If a customer signs today but pays in 45 days, then revenue may improve immediately while cash does not.
A common misconception is that profitable companies do not need detailed cash forecasting. Early-stage businesses prove the opposite all the time. If a customer signs today but pays in 45 days, then revenue may improve immediately while cash does not.
If the startup is inventory-heavy, then working capital timing deserves extra focus. If it is SaaS or services-led, then deferred revenue, annual contracts, and collection lags may drive the biggest cash swings.
How should a startup KPI dashboard differ from board-ready reporting?
A KPI dashboard is operational and frequent, while board-ready reporting is compressed and decision-led; CBMC treats both as related outputs within management reporting, but they serve different audiences.
The KPI dashboard is for management rhythm. It tells leaders whether acquisition, delivery, retention, collections, utilisation, or margin are on track. It may be updated weekly or even daily for a sales-led or transaction-heavy business.
Board-ready reporting is narrower. It should summarise what changed, why it changed, what management is doing, and where risks sit. A board pack may contain a dashboard, but it should not become a data dump. Investors and directors usually want a shorter set of metrics with commentary, forecast movement, and decisions required.
A useful test is this: if a metric does not change a funding, hiring, pricing, product, or control decision, then it probably belongs in the operational dashboard, not the board pack.
“On its technology industry page, CBMC ties management finance to monthly close, cash runway and forecasts, profitability, KPIs, and dashboards.”
For many startups, the best structure is a detailed internal dashboard plus a shorter monthly or quarterly board paper built from the same source data.
How do you turn a 3-statement model into management reporting?
The 3-statement model becomes management reporting when it is updated from actuals, linked to drivers, and used to explain future cash and profitability, not just valuation.
Penn State Smeal points to the integrated model as a common startup tool for forecasting, financing strategy, performance monitoring, financial reporting, and taxes. The startup mistake is treating it as a one-off fundraising file. It should become the engine behind management reporting.
Step 1 is to identify operating drivers. These may include units sold, monthly recurring revenue, headcount, salary bands, payment terms, marketing spend, and capex timing.
Step 2 is to link those drivers properly across the income statement, balance sheet, and cash flow statement. If revenue grows, then receivables, VAT or sales tax, deferred revenue, and cash should move logically too.
Step 3 is to compare the model with actual results every month. If assumptions keep missing reality, then revise the driver logic. Pro tip: if a model is never reconciled to actuals, it is a pitch deck accessory, not a management report.
This is where scenario modelling becomes valuable. If hiring is delayed, then runway extends. If churn rises, then next quarter’s cash collections may weaken before expenses adjust.
Which mistakes make management reports useless?
The biggest mistakes are stale data, too many metrics, poor definitions, and no link between numbers and action.
Startups often fail here because reporting becomes a collection exercise rather than a decision system. One person exports sales, another updates payroll, and someone else amends a forecast without documenting the assumption change. The result is a pack that looks polished but cannot be trusted.
Watch for these failures:
- Stale actuals: month-end close is incomplete, so decisions use half-finished numbers
- Metric overload: 30 KPIs appear, but none are clearly tied to action
- Definition drift: revenue, gross margin, and burn are calculated differently by different teams
- No accountability: variances are reported, but no owner or next step is named
A useful rule is simple. As Accotool notes in its review of management reporting software for finance teams, the real dividing line is whether a reporting setup supports consistent commentary, ownership, and follow-up rather than just exporting numbers into prettier dashboards. If the report cannot answer “what changed, why, and what next?” then it is not yet management reporting. Another misconception is that more visual charts automatically improve insight. Often a plain variance table with clear commentary is more useful than a colourful dashboard.
When should a startup move from spreadsheets to an ERP or reporting system?
A startup should move beyond spreadsheet-only reporting when volume, complexity, or control risk starts slowing the monthly close or weakening confidence in the numbers.
Spreadsheets are still practical at an early stage. They are flexible, fast, and easy to adapt while the business model is changing. The trade-off is control. Version issues, broken formulas, weak audit trails, and manual imports become more damaging once the company scales.
The trigger points are usually clear. If the startup has multiple legal entities, inventory, recurring billing, grants, payroll growth, project accounting, or cross-border reporting, then the reporting stack should connect more directly to accounting and operating systems. If teams are spending days reconciling exports before they can discuss performance, the reporting process is already too manual.
A sensible progression is spreadsheet-led reporting first, then controlled templates, then ERP-linked dashboards or finance systems once month-end speed, governance, and reporting depth matter more than flexibility. That is often the point where a stronger finance function starts paying for itself.